Validation Services
Your CTU Says 5°C. But Is It 5°C Everywhere?
Author: Phil Alfieri
Aug 24, 2026
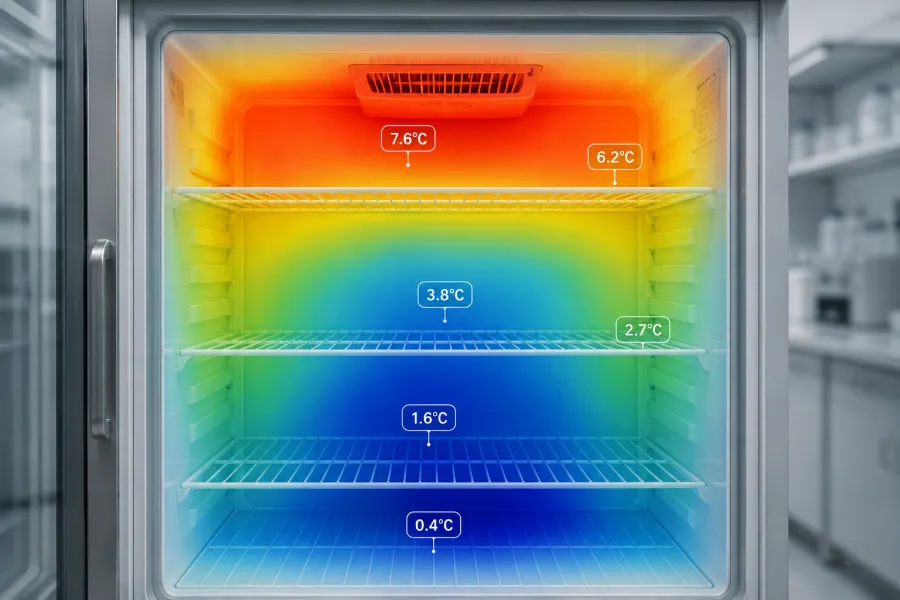
A refrigerator display may read 5°C. The monitoring point may be in range. On the surface, everything looks fine.
But that does not always mean every location inside the unit is seeing the same temperature.
In pharmaceutical, biotech, healthcare, blood banking, tissue banking, and life science environments, that difference matters. Products are not stored at the display. They are stored on shelves, in drawers, near doors, near walls, near cooling sources, and in areas where airflow may not be consistent.
That is why temperature mapping matters.
What Temperature Mapping Tells You
Temperature mapping is a documented study that shows how temperature is distributed throughout a controlled temperature unit, or CTU, over a defined period of time.
Instead of relying on one reading, multiple calibrated data loggers are placed throughout the unit. The data helps show what is happening across the usable storage area, not just at one point.
A mapping study can help answer practical questions:
- Where is the warmest location?
- Where is the coldest location?
- Are temperatures consistent throughout the storage area?
- Are there areas where product should not be placed?
- Is the monitoring probe in the right location?
- Did a change to shelving, loading, or equipment affect performance?
- Is the unit performing the way the organization expects?
For regulated organizations, these answers support better decisions about equipment use, product placement, qualification, monitoring strategy, and risk management.
Why One Reading Is Not Enough
A CTU may be set to 5°C, but that does not mean every point inside the unit is sitting at 5°C.
Temperature distribution can be affected by a number of real-world factors:
- Airflow
- Door openings
- Shelving layout
- Product loading
- Proximity to cooling components
- Probe placement
- Equipment condition
- Room conditions around the unit
This is where assumptions can create risk.
A sensor in the center of a refrigerator may show an acceptable temperature, while another area closer to the door or cooling source may behave differently. A loaded unit may perform differently than an empty one. A unit that worked well in one room may perform differently after being moved.
Temperature mapping helps replace assumptions with actual data.
Hot Spots and Cold Spots
One of the most useful outcomes of a mapping study is identifying hot spots and cold spots.
These locations matter because they show where temperature-sensitive materials may face more risk. They can also help determine where products should be stored and where ongoing monitoring points should be placed.
For example, mapping may show that one shelf consistently runs warmer than the rest of the unit. That does not automatically mean the unit has failed, but it gives the quality, lab, pharmacy, blood bank, or facilities team information they can act on.
They may decide to change storage practices, adjust loading, move a monitoring probe, investigate the unit, or document why certain areas should not be used for critical product storage.
The goal is not just to collect temperature readings. The goal is to understand what the readings mean.
Mapping and Monitoring Are Not the Same Thing
Temperature mapping and continuous monitoring are related, but they are not the same.
Mapping characterizes the environment. It shows how temperature behaves throughout the space.
Monitoring watches the environment during routine use. It provides ongoing visibility at selected monitoring points.
Both are important.
Mapping helps determine how the unit performs and where risk may exist. Monitoring helps confirm that conditions remain visible during day-to-day operation.
A good monitoring strategy should be informed by what is learned during mapping.
When Mapping Should Be Considered
Temperature mapping may be appropriate when a new refrigerator, freezer, CTU, cold room, or other controlled environment is being qualified for use.
It may also be needed when something changes.
Examples include:
- Equipment relocation
- Repairs or modifications
- Changes to shelving
- Significant changes in loading
- Changes to operating parameters
- Unexplained temperature variability
- New product or storage requirements
- Periodic requalification based on internal procedures or risk assessment
There is not one schedule that fits every organization. The right approach depends on the equipment, the product, the intended use, the quality system, and applicable requirements.
What a Good Mapping Study Includes
A useful mapping study requires more than placing loggers in a unit and downloading data later.
It should start with a defined protocol. The protocol should identify the equipment being studied, the intended conditions, the study duration, logger locations, acceptance criteria, and reporting expectations.
Data loggers should be placed in locations that help characterize the space. Depending on the unit, this may include different shelves, heights, corners, doors, return-air locations, cooling sources, and areas where temperature variation is more likely.
After the study, the data should be reviewed and documented in a way that helps the organization understand what happened.
A good report should help answer:
- Did the unit meet the acceptance criteria?
- Where were the warmest and coldest points?
- Were there areas of concern?
- Did the data support the intended use?
- What should the organization consider for monitoring, storage, or follow-up?
The value is not just in the data. The value is in turning the data into decisions.
Why This Matters
Temperature-sensitive products have defined storage requirements for a reason. If they are exposed to the wrong conditions, there may be concerns about quality, stability, efficacy, or suitability for use.
That can create operational risk, quality risk, and compliance risk.
Temperature mapping gives organizations a clearer picture of the environment surrounding their products. It helps quality, validation, lab, pharmacy, blood bank, tissue bank, and facilities teams understand how a controlled space actually performs.
A display reading is useful. A monitoring point is important. But neither one tells the full story of what is happening throughout the entire storage area.
Temperature Mapping Services from Rees Scientific
Rees Scientific provides temperature mapping services for regulated and temperature-sensitive environments, including pharmaceutical, biotechnology, healthcare, life science, blood banking, tissue banking, research, and other critical applications.
Rees maps refrigerators, freezers, CTUs, and other controlled environments using calibrated data loggers placed throughout the space. The study helps identify hot spots, cold spots, temperature patterns, and areas that may require further review.
Customers receive documented reporting, including data analysis and visual heat maps that make temperature patterns easier to understand.
Whether an organization is qualifying a new CTU, reviewing existing equipment, responding to a change, or trying to better understand a temperature-controlled space, Rees can help plan and execute a mapping study suited to the application.
Frequently Asked Questions
What is temperature mapping?
Temperature mapping is a documented study that shows how temperature is distributed throughout a controlled environment. Multiple calibrated data loggers are placed throughout the space to collect data over a defined period of time.
Why is temperature mapping important?
A single display or monitoring point does not always represent every location inside a unit. Mapping helps identify temperature variation, including hot spots and cold spots, so organizations can make better decisions about storage, monitoring, qualification, and risk.
Is temperature mapping the same as continuous monitoring?
No. Mapping characterizes the environment. Monitoring provides ongoing visibility during routine use. Mapping can help inform where monitoring points should be placed.
When should a unit be mapped?
Mapping may be performed during initial qualification, periodic requalification, after relocation, after repairs or modifications, after changes in shelving or loading, or when unexplained temperature variability occurs.
What types of equipment can be mapped?
Rees Scientific maps refrigerators, freezers, CTUs, and other controlled environments used for temperature-sensitive products and materials.
Know What Is Happening Throughout the Unit
A CTU display may tell you the temperature at one point. It does not tell you what is happening everywhere products are stored.
Temperature mapping helps close that gap.
Rees Scientific can help organizations understand temperature distribution, identify hot and cold spots, evaluate equipment performance, and document results in a way that supports product protection, quality decisions, and audit readiness.
Schedule a temperature mapping consultation with Rees Scientific.