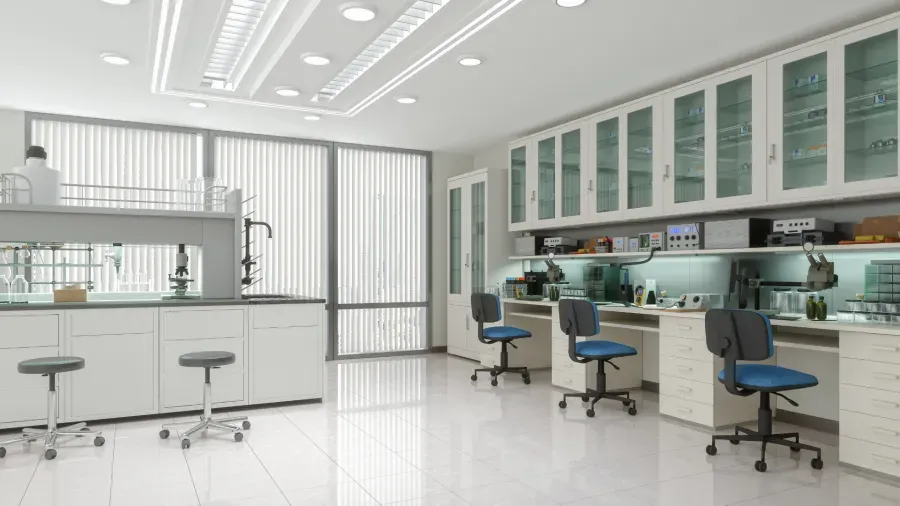
Environmental Monitoring Reporting & Dashboards
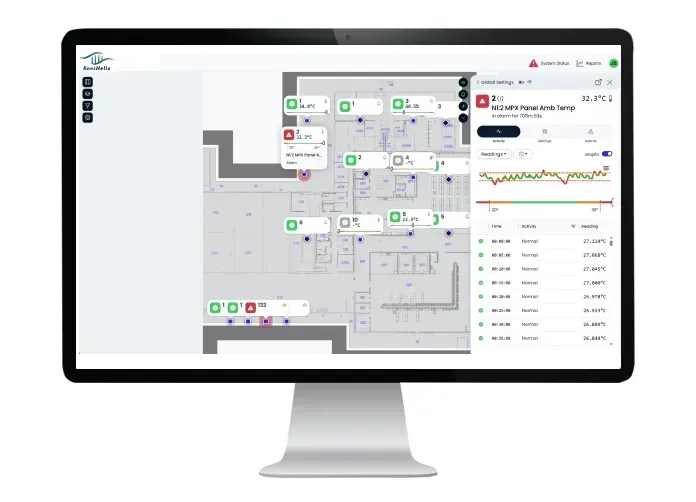
Make Environmental Monitoring Data Easier to Use
Environmental monitoring programs generate a continuous stream of data. Reporting and dashboards help transform that information into views and records that support daily operations, investigations, quality reviews, and audits.
Instead of relying on manual data collection or searching across disconnected records, authorized users can view current conditions, review historical activity, and focus on the information most relevant to their responsibilities.


Historical Data and Analytics
Gain real-time visibility into current conditions while analyzing historical trends, graphing multiple monitoring points, investigating alarm events, and exporting data for further analysis.
Review Historical Trends
Examine changes over time to identify patterns, exceptions, and recurring conditions.
Investigate Alarm Events
Use historical information to understand what occurred before, during, and after an alarm.
Graph Multiple Monitoring Points
Compare data from multiple sensors, equipment types, rooms, or areas in a single view.
Export Data
Export environmental monitoring data for additional analysis, documentation, or review.
Intelligent Dashboards Built Around Your Facility
Every organization views environmental monitoring differently. Rees Scientific software allows you to create dashboards that reflect the way your facility operates.
Whether you are responsible for one laboratory or an enterprise with multiple locations, dashboards can be customized to display the information most relevant to your role.
Create Dashboards By
- Department
- Building
- Room
- Facility
- Equipment type
- Monitoring parameter
- Alarm status
- User role
Benefits of Customizable Dashboards
- Instantly identify alarms and exceptions.
- Focus on the equipment and areas you manage.
- Improve visibility across departments and facilities.
- Reduce time spent searching for critical information.
- Support faster operational decisions.
- Personalize views for different users and teams.
Frequently Asked Questions
Yes. Daily, weekly, monthly, alarm, trend, audit, and custom reports can be automatically generated and distributed.
Yes. Dashboards can be organized by department, room, building, facility, equipment type, monitoring parameter, alarm status, or user role.
Yes. Users can analyze historical trends, graph multiple monitoring points, investigate alarm events, and export data for further analysis.
Yes. Dashboards can support visibility across one facility or multiple locations, helping users focus on the buildings, departments, equipment, and monitoring points relevant to their responsibilities.